Skip to board
Analytics.
Everything, as it runs. Hover a tile to play it, press space to look closer.
Start from
Compare these components
Choose by behavior and layout, then check the available frameworks and access requirements on each component page.
- Area chart lite
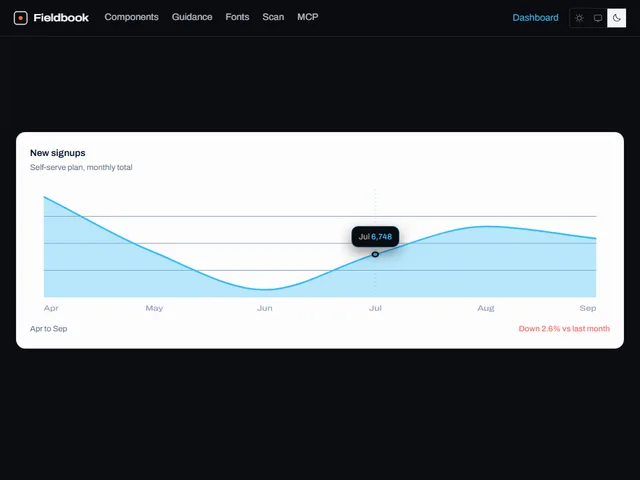
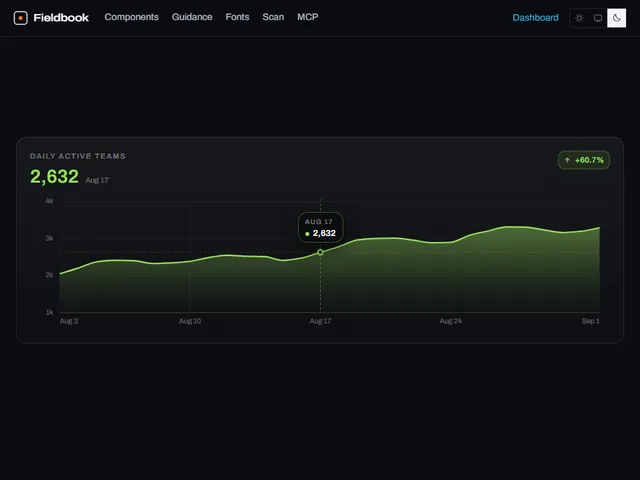
A responsive SVG area chart with round axis ticks, a gradient fill, a crosshair that reads the sample under the pointer, and a draw-on wipe.
- Gradient Area Chart
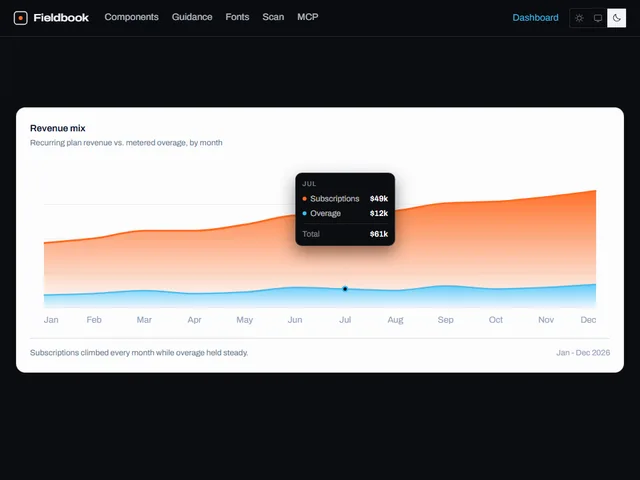
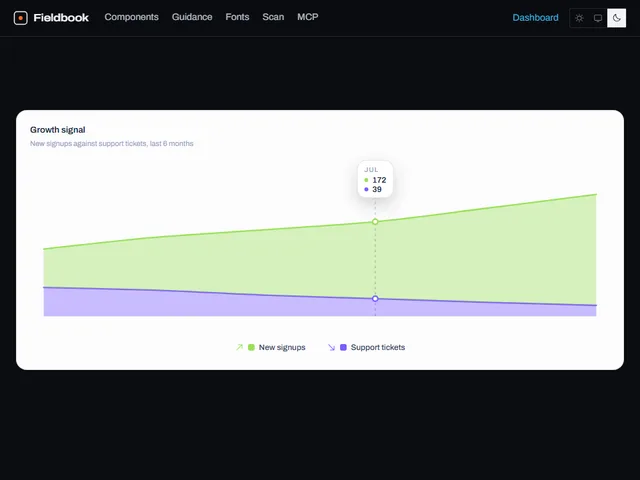
Two stacked monthly series drawn as smooth areas whose fills fade from a strong tint at the top edge down to nearly clear at the baseline.
- Gridline area chart
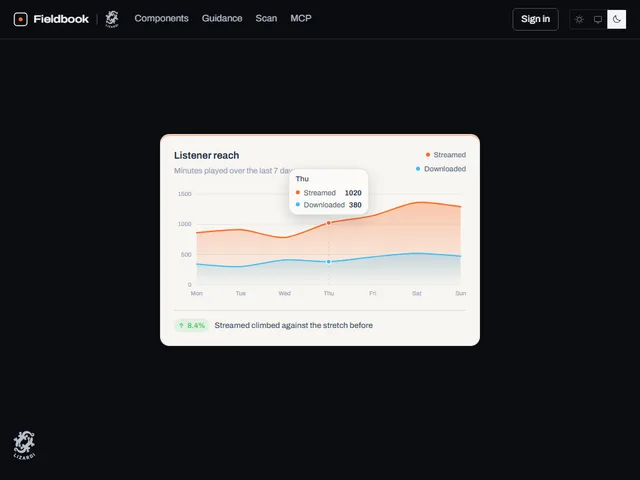
A card-framed area chart with two overlapping filled layers, rounded axis ticks, a faint gridline and a footer line calling out the trend.
Open the full index
Tags
3D (7)Administration (6)Ambient (18)Analytics (8)Animated (21)Area (9)Arrow (10)Avatar (7)Backdrop (9)Background (25)Badge (9)Bar (9)Button (158)Calendar (8)Call to action (6)Canvas (41)Card (15)Chart (32)Chip (11)Collapse (6)Confirm (13)Controlled state (10)Count (6)Counter (8)Call to action (12)Cursor (11)Customer (6)Depth (12)Diagonal (6)Dialog (11)Dot (7)Drag (8)Drawer (7)Drift (10)Expand (10)Fill (15)Flood (8)Focus (8)Follow (6)Form (24)Frame (9)Gallery (9)Glow (15)Gradient (17)Grid (13)Halo (7)Headline (6)Hero section (6)Highlight (6)Hint (6)Hover (89)Icon (44)Icon button (8)Input (9)Interactive (25)Invert (14)Label (9)Label swap (6)Layout (8)Lift (10)Light (10)Line (7)Loading (10)Loop (14)Menu (10)Metric (8)Modal (8)Monthly (6)Navigation (9)Noise (9)Orbit (7)Outline (23)Overlay (7)Page (10)Panel (15)Parallax (8)Particle (12)Perspective (9)Pill (35)Pointer (32)Popover (7)Press (28)Progress (10)Pulse (7)Reveal (30)Ring (12)Rotate (6)Row (7)Scale (9)Scroll (12)Send (7)Settings (7)Shadow (13)Share (15)Slide (10)Spring (24)Stack (7)Stagger (13)Status (8)SVG (30)Sweep (15)Switch (7)Tactile (6)Text (10)Tile (12)Tilt (10)Toggle (32)Toolbar (11)Tooltip (18)Trail (7)Trend (7)Typography (8)Underline (6)Wave (9)Wipe (6)Workflow (9)Workspace (13)