Charts
Gradient Area Chart
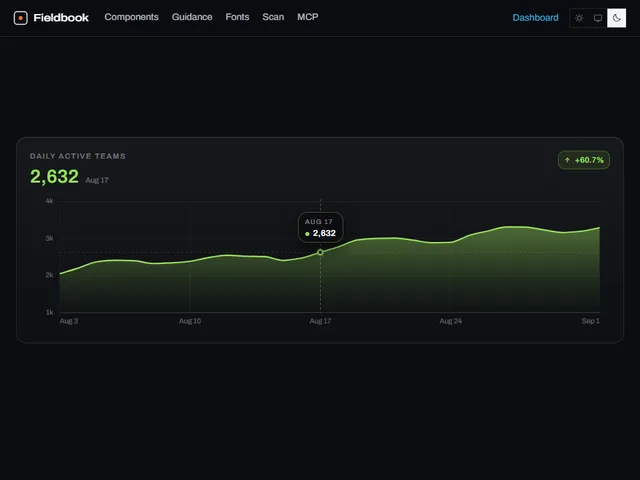
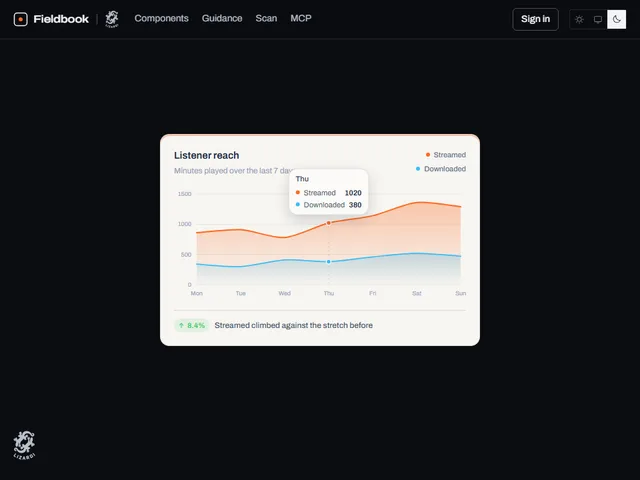
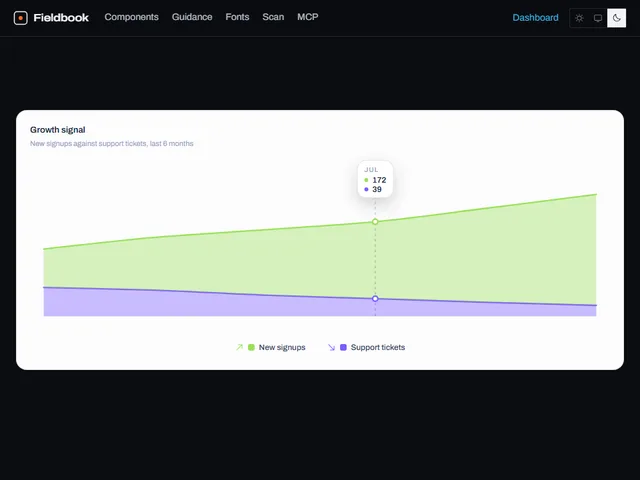
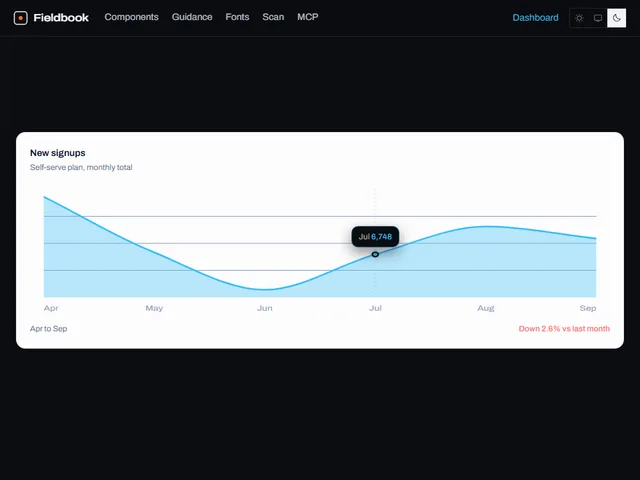
Gradient Area Chart: Two stacked monthly series drawn as smooth areas whose fills fade from a strong tint at the top edge down to nearly clear at the baseline.
Using Gradient Area Chart
Gradient Area Chart uses the wide preview frame with a light/dark theme setting.
Customize the preview
These controls are passed to the demo. Defaults and limits describe the preview; consult the implementation for its full prop API.
| Control | Type | Default | Preview limits |
|---|---|---|---|
accentColor | color | #FF6A1F | No additional limit in the metadata. |
secondColor | color | #38BDF8 | No additional limit in the metadata. |
gradientStrength | number | 0.8 | From 0.3 to 1; step 0.05 |
showGrid | boolean | true | No additional limit in the metadata. |
animate | boolean | true | No additional limit in the metadata. |
Which frameworks are available for Gradient Area Chart?
Gradient Area Chart is available for React, Vue, Svelte, Astro, HTML. The live preview uses React; the source observations below apply to index.tsx. Check the selected port before relying on the same interactions.
What does Gradient Area Chart depend on?
The React metadata lists these npm dependencies beyond React: motion, clsx, tailwind-merge.
What accessibility details are visible in Gradient Area Chart?
The React source for Gradient Area Chart includes: attributes and handlers (aria-hidden, aria-label, onKeyDown, tabIndex); explicit roles (img); key comparisons (ArrowLeft, ArrowRight, End, Escape, Home). These are source observations. Verify accessible names, focus order and keyboard behavior in the composed page.
How does Gradient Area Chart handle reduced motion?
Gradient Area Chart reads the motion preference in its React source through useReducedMotion(). Check the full implementation, shared styles and selected port with reduced motion enabled; these observations do not establish that every animation stops.