Charts
Profit/Loss Line Chart
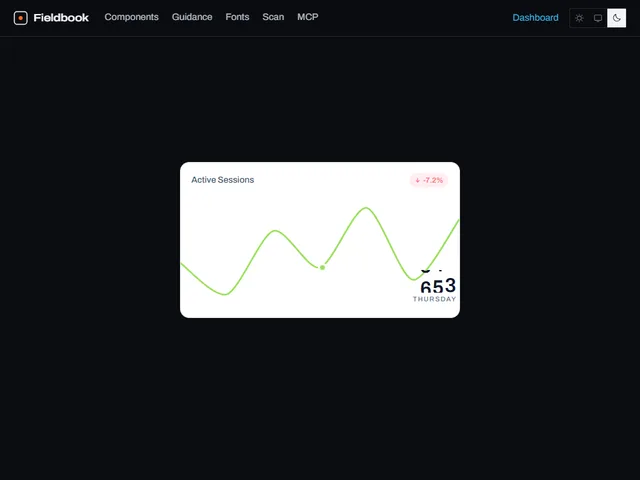
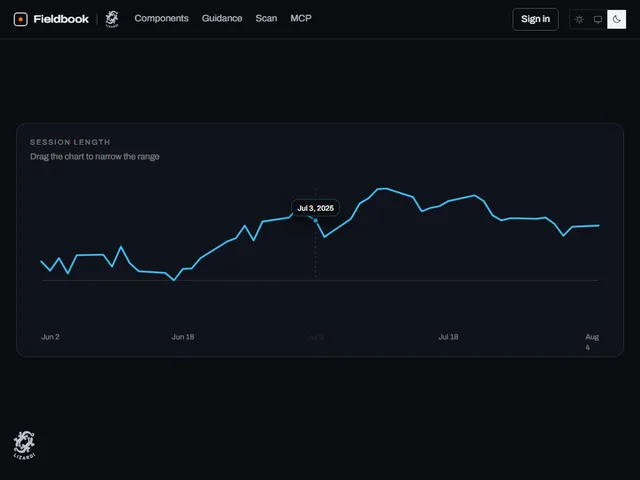
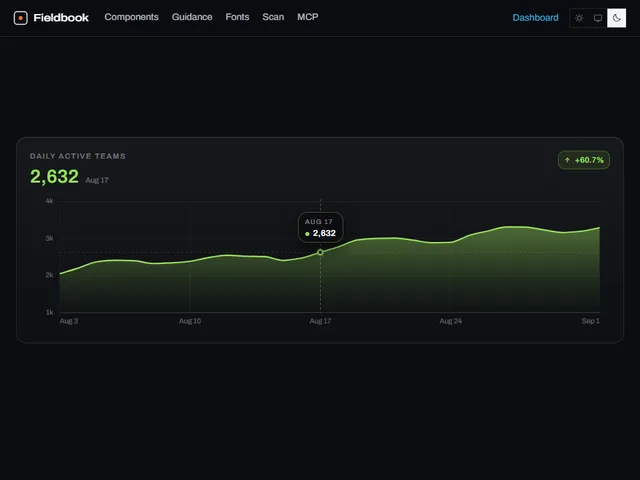
Profit/Loss Line Chart: A line chart whose stroke changes color depending on whether the value is above or below zero, splitting cleanly at each crossing point.
Using Profit/Loss Line Chart
Profit/Loss Line Chart uses the wide preview frame with a dark theme setting.
Customize the preview
These controls are passed to the demo. Defaults and limits describe the preview; consult the implementation for its full prop API.
| Control | Type | Default | Preview limits |
|---|---|---|---|
positiveColor | color | #34D399 | No additional limit in the metadata. |
negativeColor | color | #F87171 | No additional limit in the metadata. |
strokeWidth | number | 3 | From 1 to 6; step 0.5 |
smooth | boolean | false | No additional limit in the metadata. |
Which frameworks are available for Profit/Loss Line Chart?
Profit/Loss Line Chart is available for React, Vue, Svelte, Astro, HTML. The live preview uses React; the source observations below apply to index.tsx. Check the selected port before relying on the same interactions.
What does Profit/Loss Line Chart depend on?
The React metadata lists these npm dependencies beyond React: motion, clsx, tailwind-merge.
What accessibility details are visible in Profit/Loss Line Chart?
The React source for Profit/Loss Line Chart includes: native elements (button); attributes and handlers (aria-hidden, aria-label, onKeyDown, tabIndex); explicit roles (img); key comparisons (ArrowLeft, ArrowRight, Escape). These are source observations. Verify accessible names, focus order and keyboard behavior in the composed page.
How does Profit/Loss Line Chart handle reduced motion?
Profit/Loss Line Chart reads the motion preference in its React source through useReducedMotion(). Preference-dependent expressions in index.tsx: delay: reduce ? 0 : i * 0.06; duration: reduce ? 0 : 0.7. Check the full implementation, shared styles and selected port with reduced motion enabled; these observations do not establish that every animation stops.