Build an operations dashboard
Combine an analytics overview, a saved-view data grid and an audit timeline into an interface for daily operational decisions.
Interactive example with illustrative data. Your application supplies the connected services.
Components in this recipe
Build it yourself
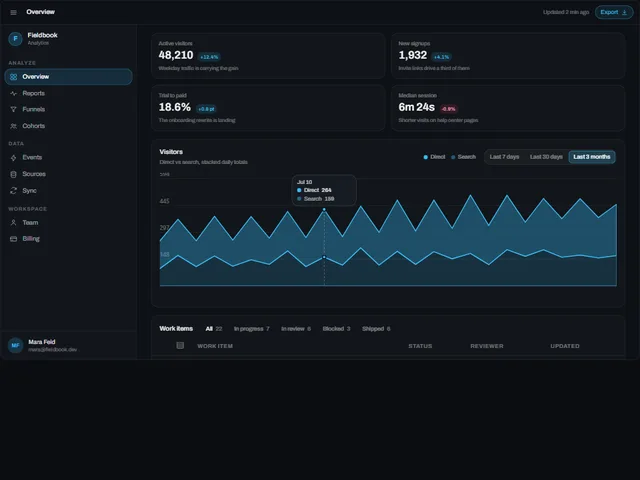
- Start with the analytics console. Define the reporting period and units before connecting summary values and chart data.
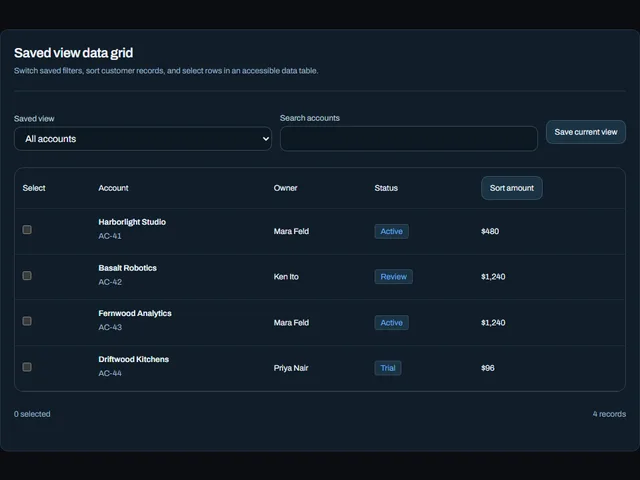
- Place the saved-view data grid beneath the overview. Keep its filters, selection and pagination in your application state.
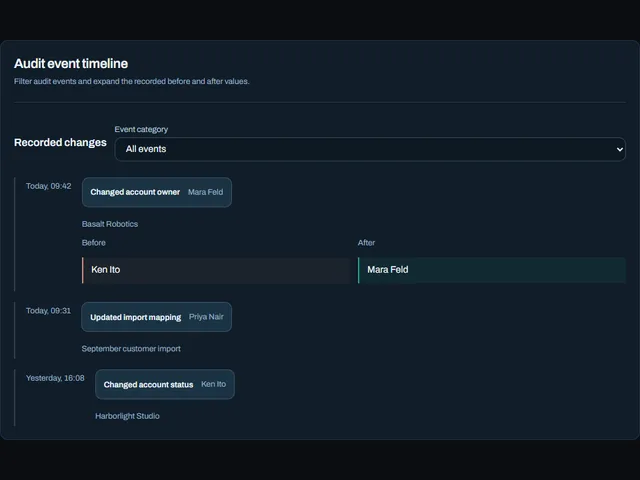
- Use the audit timeline beside a selected record. Fetch only events the signed-in user is allowed to see.
Build with your agent
A ready-to-use task for your connected coding agent.
Members only
Connect your application
Your application supplies aggregation, pagination, authorization and persistence. Keep currency and time-zone formatting consistent across the overview, records and events.
Verify the result
Test an empty period, delayed data, a failed request and a narrow viewport. Changing a saved view must update the visible records without losing keyboard focus.